This project has the goal of creating a production security stack, with the capability to gain visibility into all alerts without the alert fatigue experienced by an individual homelabber.
This article assumes you have ELK installed, if you have not done that, navigate to my other blog on the subject at: ELK Stack Install
Project Steps and outcomes
- Configure PCI passthrough and port mirroing on proxmox
- Install and configure Suricata
- Install and configure Zeek
- Configure n8n on Ubuntu machine
- Download and run Llama Large Language Models using an Ollama server
- Set up n8n workflow to pass alerts from ELK to Discord
Project Hardware and software inventory
Hardware
- Dell PowerEdge R630 server
- Cisco SG200-50FP switch
- Desktop
Software
- Proxmox
- Ubuntu 24.04 Virtual Machine (For ELK stack)
- Elastic Stack / agent
- Suricata
- Zeek
- Ollama
- n8n
- Discord
- Cloudflare domain
Outcomes
- Eliminate alert fatigue using Large Language Models
- Have visibility into correlated alerts from various attack surfaces (Network, endpoint)
- Risk based scoring system
- SOAR functionality using n8n
- Get Incident Response recommendations
- Capability to respond to alerts as a 1 manned IT team
- Learn about networking, AI automation, deploying common open source tools like Suricata, Zeek, Elastic
- Cost to value
Step #1: Configure PCI pass-through and port mirroring
If you want to get east to west / north to south traffic, you are likely going to need to configure a SPAN/Mirror port on your switch to collect the traffic. If you are mirroring to a interface within a hypervisor, you will also need to configure PCI pass-through for the traffic to be accepted by the interface.
Navigate to Port and VLAN mirroring on your current switch

Make sure you are aware of the destination port you would like to configure to receive the traffic, and identify the ports you would like to mirror RX and TX traffic to
Next steps will be to verify IOMMU is enabled on your hypervisor host. This is needed to enable the physical NIC to pass through traffic on the host, allowing a physical port on the host to be directly assigned to a virtual machine, essentially giving the VM direct access to the hardware.
Enable IOMMU in GRUB Boot parameters
Edit /etc/default/grub
nano /etc/default/grubFor intel based CPU’s (What I am running) run the following command:
GRUB_CMDLINE_LINUX_DEFAULT="quiet intel_iommu=on"Lastly, run:
update-grubNavigate to your command line on your hypervisor host and run
dmesg | grep -e DMAR -e IOMMUThere should be a line that looks like “DMAR: IOMMU enabled”. If there is no output, something is wrong.
Ensure the required VFIO modules are loaded at boot
echo -e "vfio\nvfio_iommu_type1\nvfio_pci\nvfio_virqfd" >> /etc/modulesCreate or modify /etc/modprobe.d/vfio.conf
options vfio-pci ids=1234:abcdReplace 1234:abcd with your actial device vendor and device ID from lspci -nn
Find the PCI ID of the device you want to pass through
lspci -nnYou should see something like this:
03:00.0 VGA compatible controller [0300]: NVIDIA Corporation GP104 [10de:1b81]
Bind that device
echo "10de 1b81" > /sys/bus/pci/drivers/vfio-pci/new_idWe also want to make sure that the devices we want to pass through are in a seperate IOMMU group
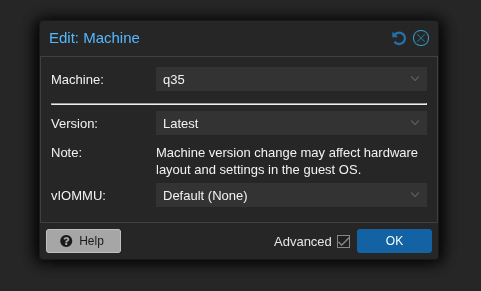
echo "10de 1b81" > /sys/bus/pci/drivers/vfio-pci/new_idAdd q35 as the machine type within Proxmox hardware settings of your configured virtual machine
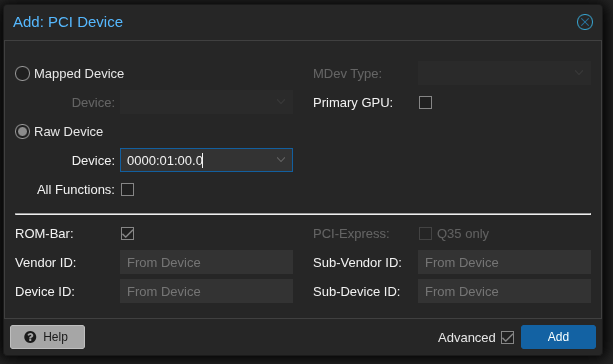
Configure PCiE pass-through on proxmox virtual machine (Make sure to also select PCI-Express.). The PCI device you are adding should be mapped to the correct physical Ethernet port that you have plugged in.
Reboot the machine
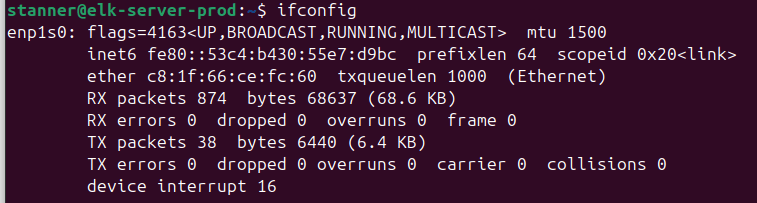
Find the new interface that was added from the PCI device
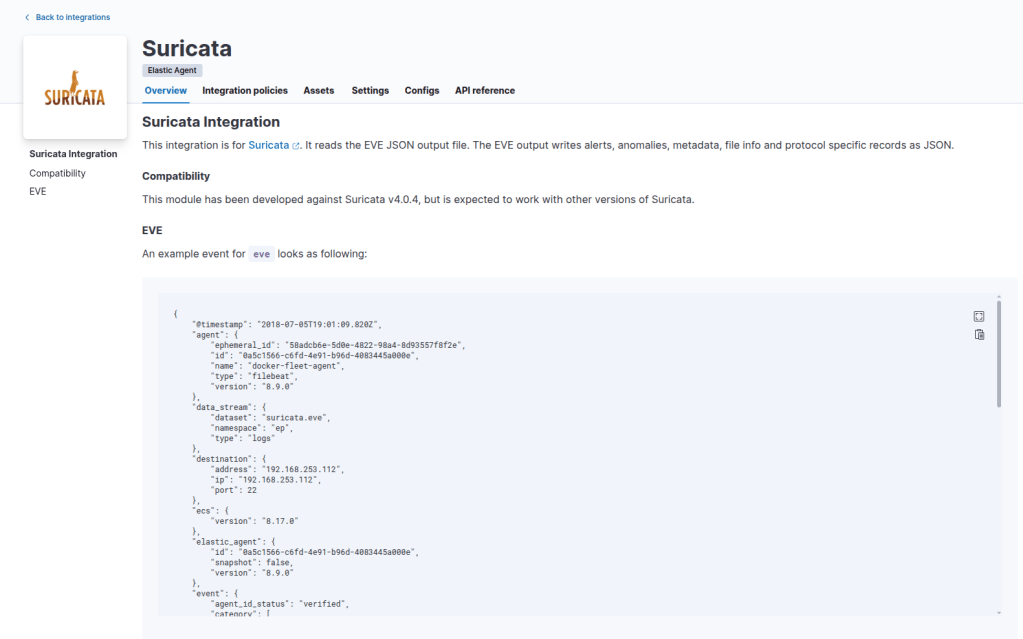
Step #2: Configure Suricata
First, install suricata on your Virtual Machine
sudo apt install -y software-properties-common
sudo add-apt-repository ppa:oisf/suricata-stable
sudo apt update
sudo apt install -y suricata
suricata --build-info
sudo systemctl enable suricata
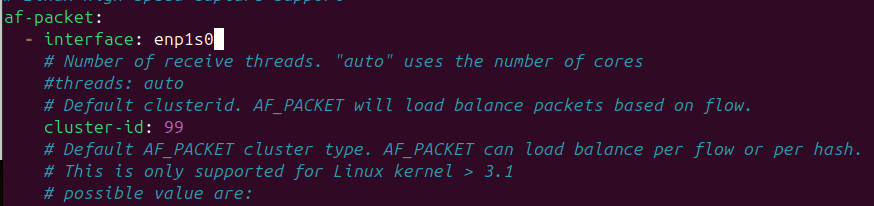
sudo systemctl start suricataNavigate to the suricata yaml file (etc/suricata/suricata.yaml) and add the interface to the af-packet field
Run the following command to reload the new suricata config file
sudo suricata -T -c /etc/suricata/suricata.yamlRestart suricata
sudo systemctl restart suricata
sudo systemctl status suricataTo make sure you are getting east to west traffic, you can test multiple ways. I just went on my desktop, refreshed a couple web pages and ensured those logs were appearing on the tcpdump.
sudo tcpdump -i enp1s0 port 443 -nAdd the integration to your fleet server agent within your ELK stack
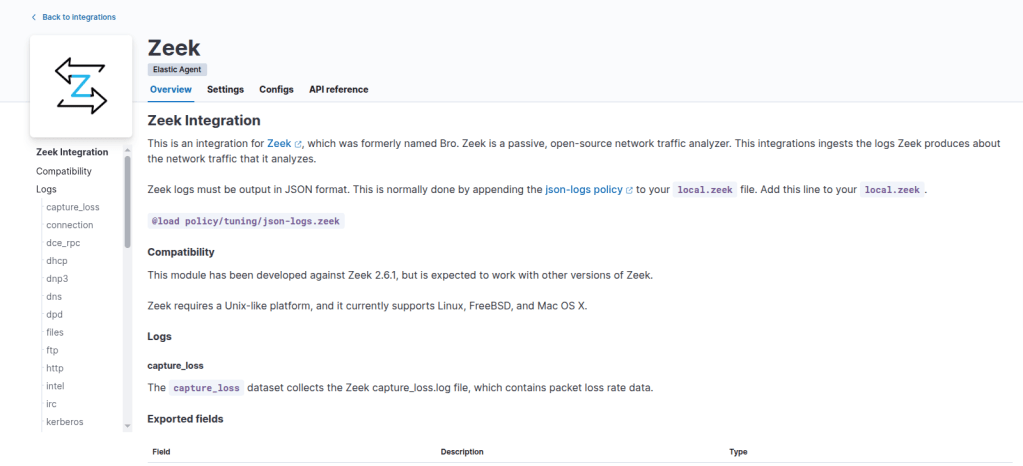
Step #3: Configure Zeek
Install the dependencies and add the Zeek APT repository
echo 'deb http://download.opensuse.org/repositories/security:/zeek/xUbuntu_24.04/ /' | sudo tee /etc/apt/sources.list.d/security:zeek.list
curl -fsSL https://download.opensuse.org/repositories/security:zeek/xUbuntu_24.04/Release.key \
  | gpg --dearmor | sudo tee /etc/apt/trusted.gpg.d/security_zeek.gpg > /dev/null
sudo apt update
Install Zeek
sudo apt install zeek -y
Configure Zeek and define your internal networks
sudo nano /opt/zeek/etc/networks.cfgDeploy Zeek and check your configuration
sudo /opt/zeek/bin/zeekctl deploy
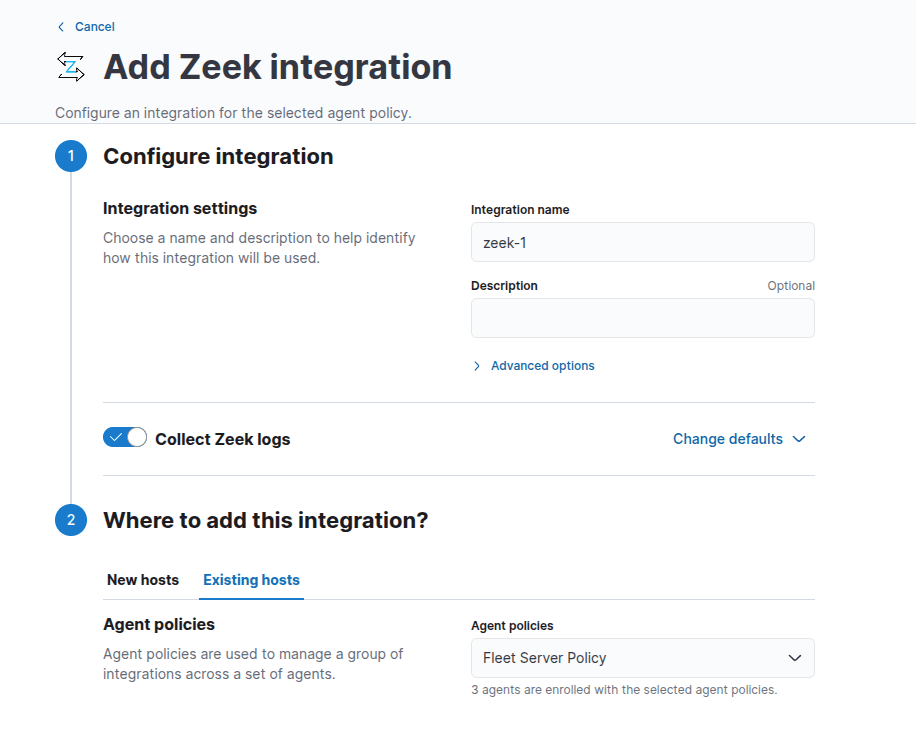
sudo /opt/zeek/bin/zeekctl deployAdd Zeek integration in Elastic
Add the integration to an existing fleet server policy if you are installing it on the ELK server
Enable Zeek JSON Logging, go to the local.zeek file
sudo nano /opt/zeek/share/zeek/site/local.zeekAdd this line to the bottom of the file:
@load policy/tuning/json-logs.zeekRestart Zeek and apply your changes
cd /opt/zeek/bin
sudo ./zeekctl stop
sudo ./zeekctl deploy
You can validate log ingestion by going to Observability> Logs and changing All logs to zeek. Repeat this for any of the other log sources if you would like to.
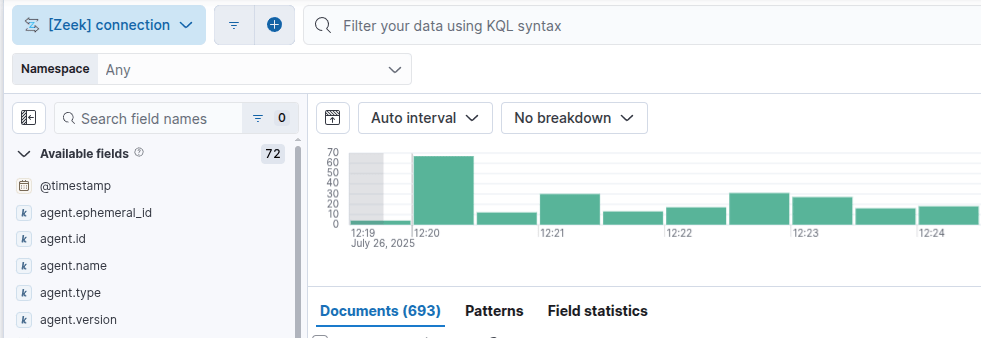
I encountered an indices error because I did not have enough space on disk. If you encounter an error that likely is going to be the issue as there is a lot of traffic here.
Step #4: Deploy Elastic Agent to endpoints
Navigate to Fleet > Agents within Elastic and select Add Agent
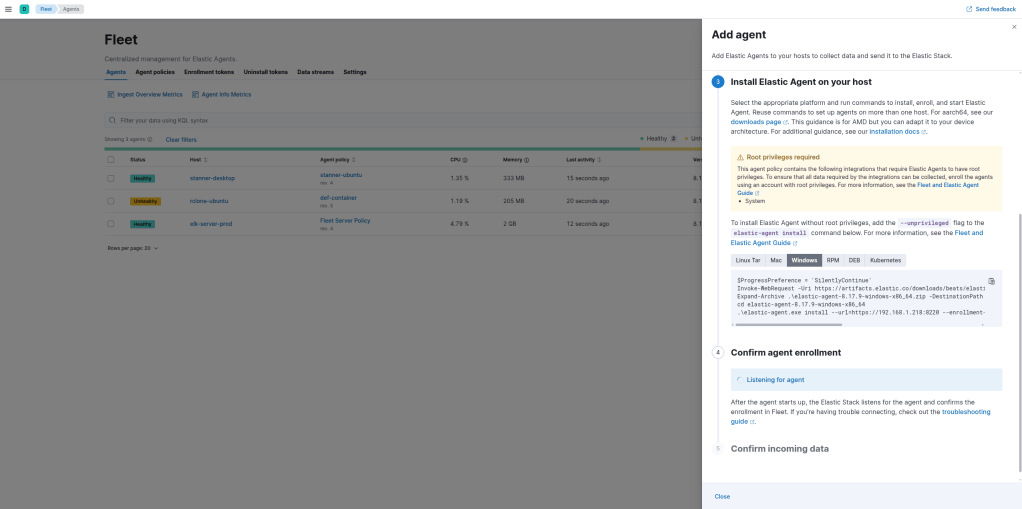
Copy the install script given to run and run it with administrator privileges on your command line, here is an example below for a windows machine
$ProgressPreference = 'SilentlyContinue'
Invoke-WebRequest -Uri https://artifacts.elastic.co/downloads/beats/elastic-agent/elastic-agent-8.17.9-windows-x86_64.zip -OutFile elastic-agent-8.17.9-windows-x86_64.zip
Expand-Archive .\elastic-agent-8.17.9-windows-x86_64.zip -DestinationPath .
cd elastic-agent-8.17.9-windows-x86_64
.\elastic-agent.exe install --url=https://192.168.1.218:8220 --enrollment-token=blM1TFlaY0eFRjgjdkSkfkglkjJshjrrlOwjflgjSjrwLWROQQ== --insecure
Make sure to add the –insecure flag if you are using self signed scripts, or else the agent will fail to install
You can add as many integrations as you would like for each agent policy, but for this project you want to have Elastic Defend installed to collect endpoint telemetry. I do not have a windows machine, but if you are running one you would want to install and configure sysmon as well.

Step #5: Configure n8n on Ubuntu server
First I am going to configure an Ubuntu 24 machine on proxmox to configure the n8n service.
After the machine is up and running, we need to navigate to Cloudflare to create a tunnel between the docker container and our domain hosted in Cloudflare.
Navigate to your domain in cloudflare and enable or go to Zero Trust in the left hand column

Navigate to Networks > Tunnels
Select Create Tunnel and select Cloudflared
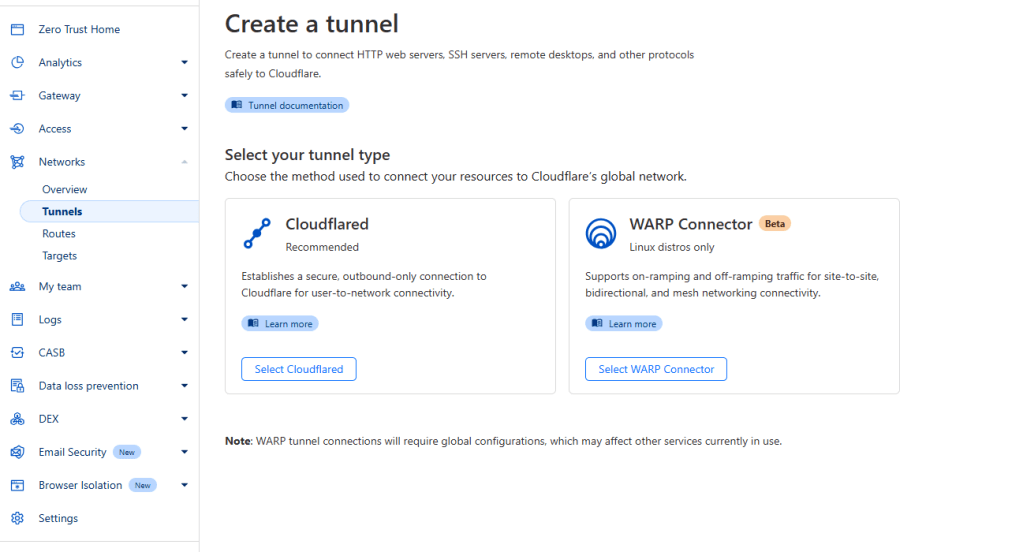
First name your tunnel. You should now see a configuration page to select an installation option. Since we are running an ubuntu machine, we are going to op to install it using docker.
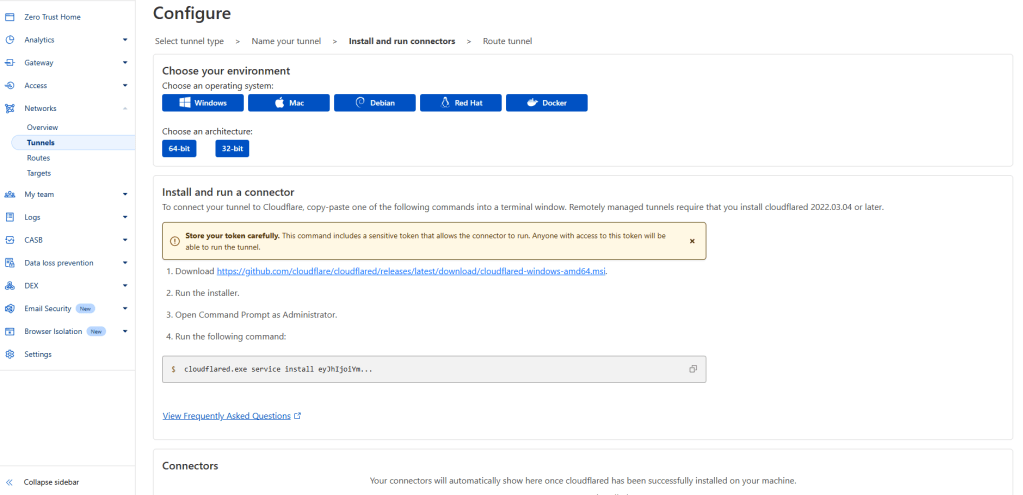
Select docker and copy the command given by cloudflare, this will setup the initial tunnel configuration for n8n to communicate through
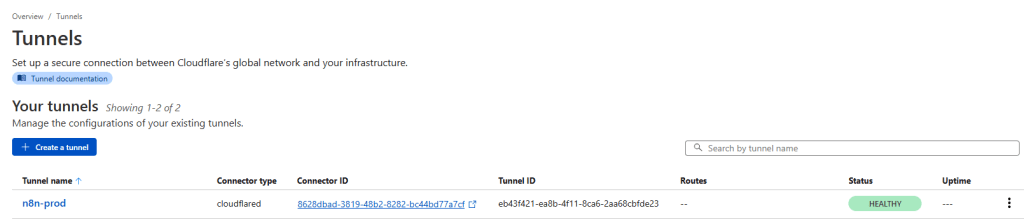
After running the command, you should see the connection appear in the Cloudflare console
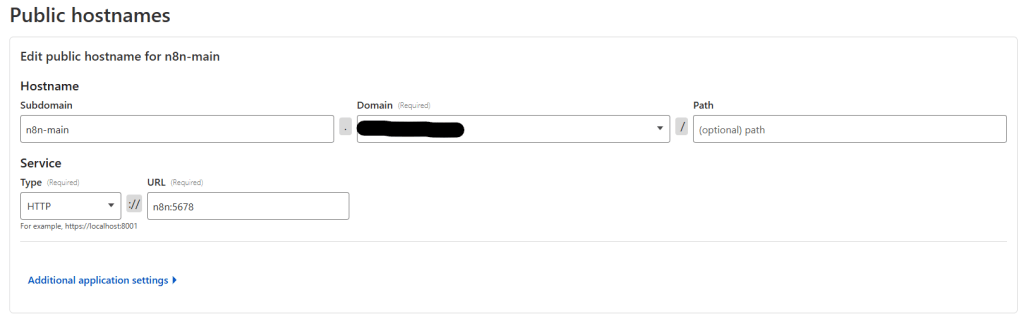
Within the public hostname field, fill out your subdomain. For service select HTTP and use n8n as the URL. The cloudflare tunnel uses n8n as the hostname to resolve when access the container.
Next step is going to be to install the n8n server (because we already have the cloduflare tunnel configured)
Navigate to the n8n docs to view the docker compose installation and go to step 4 to follow along
We have already completed the first couple steps, and need to move to step 4 in the documentation
Create a n8n-compose directory
mkdir n8n-compose
cd n8n-compose
While in this directory, we are going to create a .env file
nano .envPaste this config from the documentation
# DOMAIN_NAME and SUBDOMAIN together determine where n8n will be reachable from
# The top level domain to serve from
DOMAIN_NAME=example.com

# The subdomain to serve from
SUBDOMAIN=n8n

# The above example serve n8n at: https://n8n.example.com

# Optional timezone to set which gets used by Cron and other scheduling nodes
# New York is the default value if not set
GENERIC_TIMEZONE=Europe/Berlin

# The email address to use for the TLS/SSL certificate creation
[email protected]
Change the DOMAIN_NAME field to your domain within cloudflare, not including the sub-domain. Adjust the subdomain field to just the sub-domain portion (mine was n8n-prod), adjust the time zone to your location, and you can leave SSL_EMAIL blank if you are installing on-prem like me.
Create a local files directory (within the n8n-compose directory)
mkdir local-filesNext we are going to create a docker-compose yaml file and paste in the n8n configuration from the documentation
nano docker-compose.ymlservices:
traefik:
image: "traefik"
restart: always
command:
- "--api.insecure=true"
- "--providers.docker=true"
- "--providers.docker.exposedbydefault=false"
- "--entrypoints.web.address=:80"
- "--entrypoints.web.http.redirections.entryPoint.to=websecure"
- "--entrypoints.web.http.redirections.entrypoint.scheme=https"
- "--entrypoints.websecure.address=:443"
- "--certificatesresolvers.mytlschallenge.acme.tlschallenge=true"
- "--certificatesresolvers.mytlschallenge.acme.email=${SSL_EMAIL}"
- "--certificatesresolvers.mytlschallenge.acme.storage=/letsencrypt/acme.json"
ports:
- "80:80"
- "443:443"
volumes:
- traefik_data:/letsencrypt
- /var/run/docker.sock:/var/run/docker.sock:ro
n8n:
image: docker.n8n.io/n8nio/n8n
restart: always
ports:
- "5678:5678"
labels:
- traefik.enable=true
- traefik.http.routers.n8n.rule=Host(`${SUBDOMAIN}.${DOMAIN_NAME}`)
- traefik.http.routers.n8n.tls=true
- traefik.http.routers.n8n.entrypoints=web,websecure
- traefik.http.routers.n8n.tls.certresolver=mytlschallenge
- traefik.http.middlewares.n8n.headers.SSLRedirect=true
- traefik.http.middlewares.n8n.headers.STSSeconds=315360000
- traefik.http.middlewares.n8n.headers.browserXSSFilter=true
- traefik.http.middlewares.n8n.headers.contentTypeNosniff=true
- traefik.http.middlewares.n8n.headers.forceSTSHeader=true
- traefik.http.middlewares.n8n.headers.SSLHost=${DOMAIN_NAME}
- traefik.http.middlewares.n8n.headers.STSIncludeSubdomains=true
- traefik.http.middlewares.n8n.headers.STSPreload=true
- traefik.http.routers.n8n.middlewares=n8n@docker
environment:
- N8N_HOST=${SUBDOMAIN}.${DOMAIN_NAME}
- N8N_PORT=5678
- N8N_PROTOCOL=https
- NODE_ENV=production
- WEBHOOK_URL=https://${SUBDOMAIN}.${DOMAIN_NAME}/
- GENERIC_TIMEZONE=${GENERIC_TIMEZONE}
volumes:
- n8n_data:/home/node/.n8n
- ./local-files:/files
volumes:
n8n_data:
traefik_data:Connect the cloudflared container to the container running n8n and restart the service
sudo docker network connect n8n-compose_default jolly_dirac
sudo docker restart jolly_dirac
Start the docker container
sudo docker compose up -dNavigate to your domain and a setup page should appear
Step #6: Configure Ollama Server (Optional)
If you have the capability to run ollama locally go for it! But this also will work using common LLM APIs like Anthropic or ChatGPT
To install Ollama on your local machine, use the Ollama install script on the website
curl -fsSL https://ollama.com/install.sh | shMake sure that the ollama server is listening on all ports so we can access it via n8n
sudo mkdir -p /etc/systemd/system/ollama.service.d/
sudo tee /etc/systemd/system/ollama.service.d/override.conf <<EOF
[Service]
Environment="OLLAMA_HOST=0.0.0.0"
EOF
Save and reload the configuration
sudo systemctl daemon-reload
sudo systemctl restart ollama
Navigate to your server IP hosted on port 11434, you should now see a page that states “Ollama is running”
To download and run a model, navigate to the models page on Ollama’s website (https://ollama.com/search)
ollama run llama3.2:latest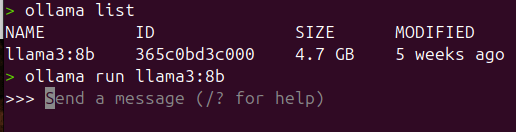
Step #7: Create workflow for Autonomous SOC
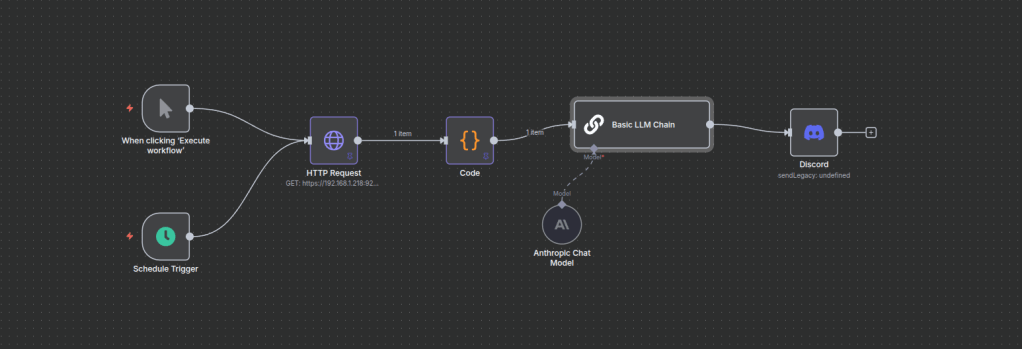
Next up, we need to create a workflow that grabs the alerts coming from our ELK instance, and formats them in a way to pass to an LLM, and then on to our notification service, which is going to be discord.
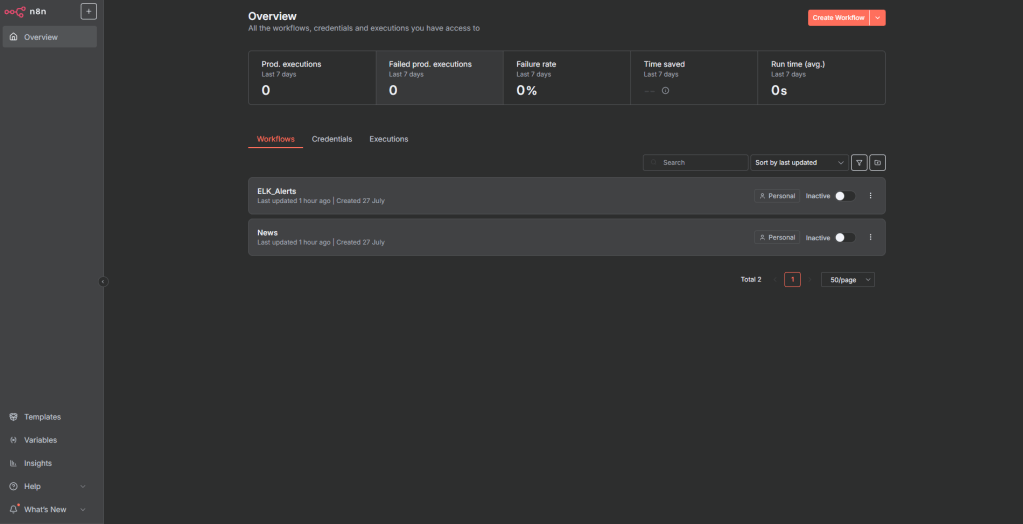
Navigate to your n8n instance, and create a new workflow
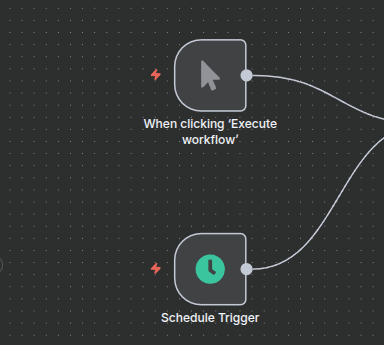
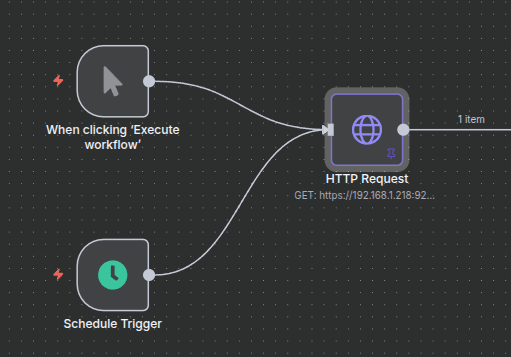
One on the workflow, add a “schedule trigger node” as well as a “Execute Workflow” trigger.
The most important stage is going to be to create an HTTP request to our ELK instance that can properly grab all of the alerts.
Add a new HTTP request node and connect it to the trigger nodes
The URL of the curl request should look something like this:
https://%5Binsert ip address here]/.alerts-security.alerts-default-*/_search
The HTTP GET request should be formatted to something similar below:
{
  "size": 500,
  "_source": [
    "@timestamp",
    "kibana.alert.rule.name",
    "kibana.alert.rule.severity",
    "kibana.alert.rule.risk_score",
    "message",
    "process.command_line",
    "host.ip",
    "source.address",
    "destination.address",
    "network.source.ip",
    "network.destination.ip"
  ],
  "query": {
    "bool": {
      "filter": [
        {
          "range": {
            "@timestamp": {
              "gte": "now-1d/d",
              "lte": "now"
            }
          }
        }
      ],
      "should": [
        {
          "exists": {
            "field": "kibana.alert.rule.name"
          }
        },
        {
          "match_phrase": {
            "kibana.alert.rule.name": "Threat Intel Match"
          }
        }
      ],
      "minimum_should_match": 1
    }
  },
  "sort": [
    {
      "@timestamp": {
        "order": "desc"
      }
    }
  ]
}
const searchResponse = $input.item.json;
const hits = searchResponse.hits.hits;
let combinedText = hits.map(hit => {
const source = hit._source || {};
const timestamp = source['@timestamp'] || 'N/A';
const ruleName = source['kibana.alert.rule.name'] || 'N/A';
const severity = source['kibana.alert.rule.severity'] || 'N/A';
const riskScore = source['kibana.alert.rule.risk_score'] !== undefined ? source['kibana.alert.rule.risk_score'] : 'N/A';
const message = source['message'] || 'N/A';
// Collect all IPs into a string if host.ip is an array
let ip = 'N/A';
if (Array.isArray(source.host?.ip) && source.host.ip.length > 0) {
ip = source.host.ip.join(', ');
} else if (typeof source['source.ip'] === 'string') {
ip = source['source.ip'];
} else if (typeof source['destination.ip'] === 'string') {
ip = source['destination.ip'];
}
const processCmd = source.process?.command_line || 'N/A';
return `Timestamp: ${timestamp} | Rule: ${ruleName} | Severity: ${severity} | Risk Score: ${riskScore} | IPs: ${ip} | Process Command Line: ${processCmd} | Message: ${message}`;
}).join('\n');
return [{
json: {
combinedAlertsText: combinedText
}
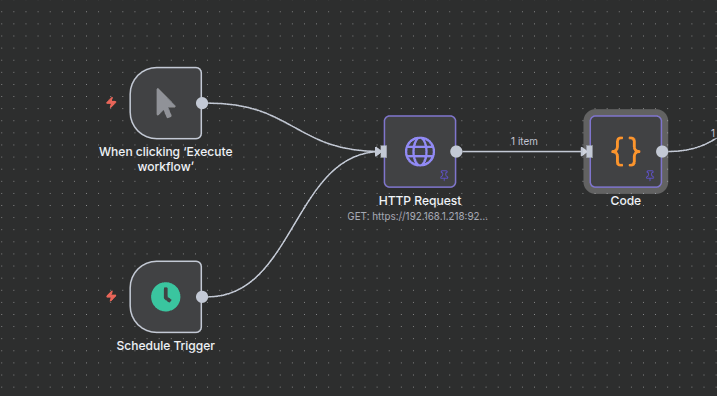
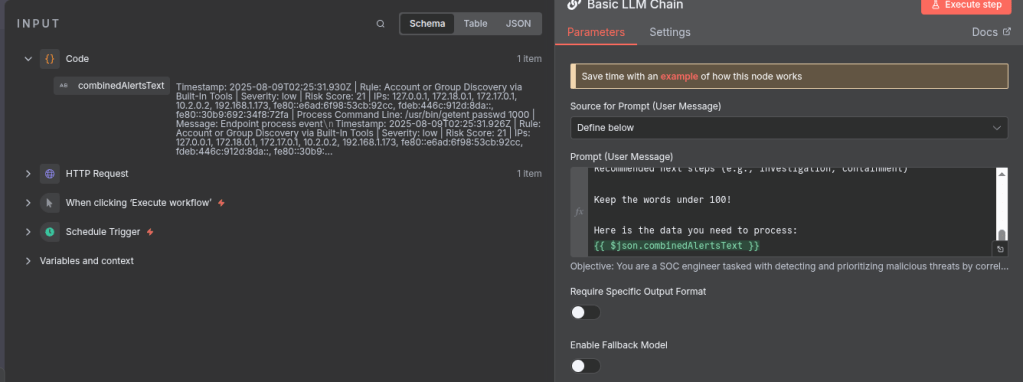
}];When this step is executed, you should be able to see all of your alerts in a single text-based format.
Now to the fun part, let’s add an LLM of our choice to use to review these alerts for us. We can use many different ones, whether they be Ollama, Anthropic, OpenAI, etc. I am going to use Anthropic for this example, but it is perfectly fine to use our Ollama configuration as well.
Select “AI Nodes” and navigate to the “Basic LLM Chain” option below
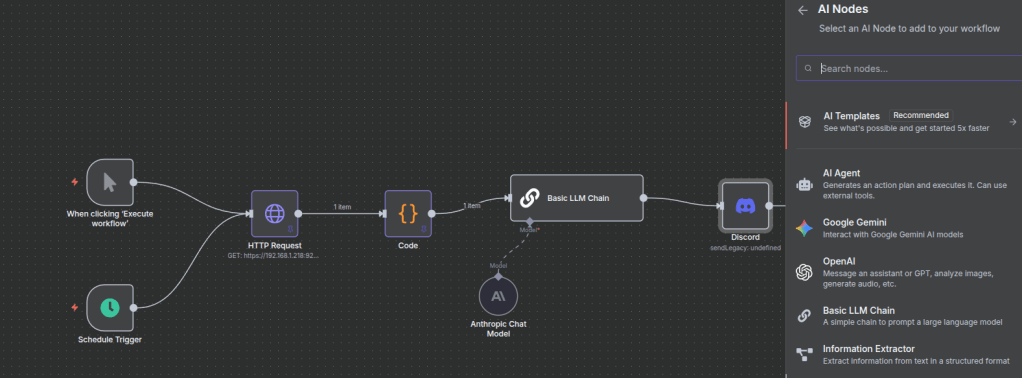
Once adding the node, select the + button to add a model of your choice.
After completing that step, select the “Basic LLM Chain” node and add a prompt of your choice.
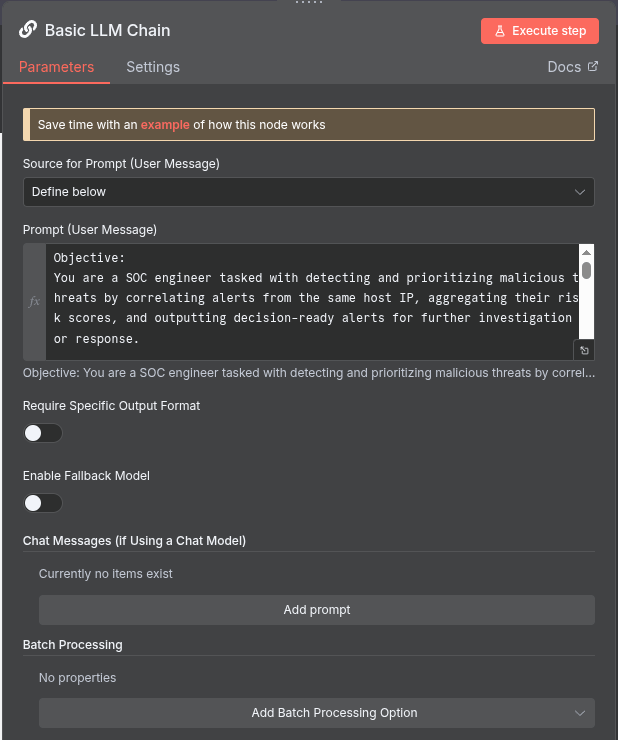
I have inserted my sample prompt below:
Objective:
You are a SOC engineer tasked with detecting and prioritizing malicious threats by correlating alerts from the same host IP, aggregating their risk scores, and outputting decision-ready alerts for further investigation or response.

Process:

Input: Receive a new alert containing:

Host IP address

Alert ID

Alert description

Risk score (numerical value)

Timestamp

Other relevant metadata (user, asset, event type)

Correlation:

Query all existing alerts from the same host IP within a relevant time window (e.g., last 24 hours).

Extract the risk scores from these correlated alerts.

Aggregation:

Sum all risk scores (including the new alert).

EXCLUDE ANYTHING THAT IS LOW (Risk score of 21 or below) AND DO NOT ADD THE RISK SCORE - RELABEL AS INFORMATIONAL.

Let this sum = Total Risk Score

Decision Logic:

If Total Risk Score > 100:

Generate an actionable alert message with all contextual details, summarized as follows:

Host IP

Number of correlated alerts

Individual and total risk scores

Key alert descriptions

Suggested priority level (High)

Timestamp range of correlated alerts

Process Command Line information

Recommended next steps (e.g., investigation, containment)

Keep the words under 100!

Here is the data you need to process:
{{ $json.combinedAlertsText }}
Notice at the end the json script block I added, you need to make sure to add this as it is the context (text) we created after running the javascript code.
You can easily just drag and drop the input into the prompt
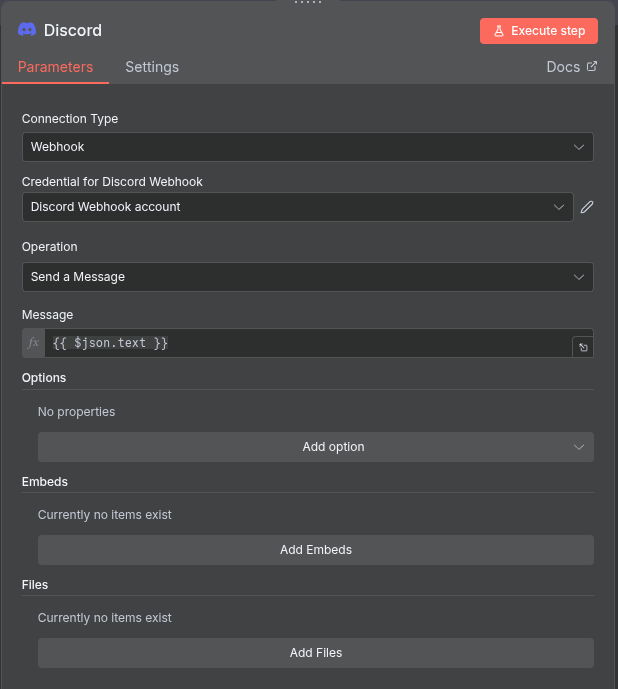
Now for the last step, add a discord node.
All we need to do to configure the discord node is grab the webhook from one of our chat rooms within our server and add it to the configuration.
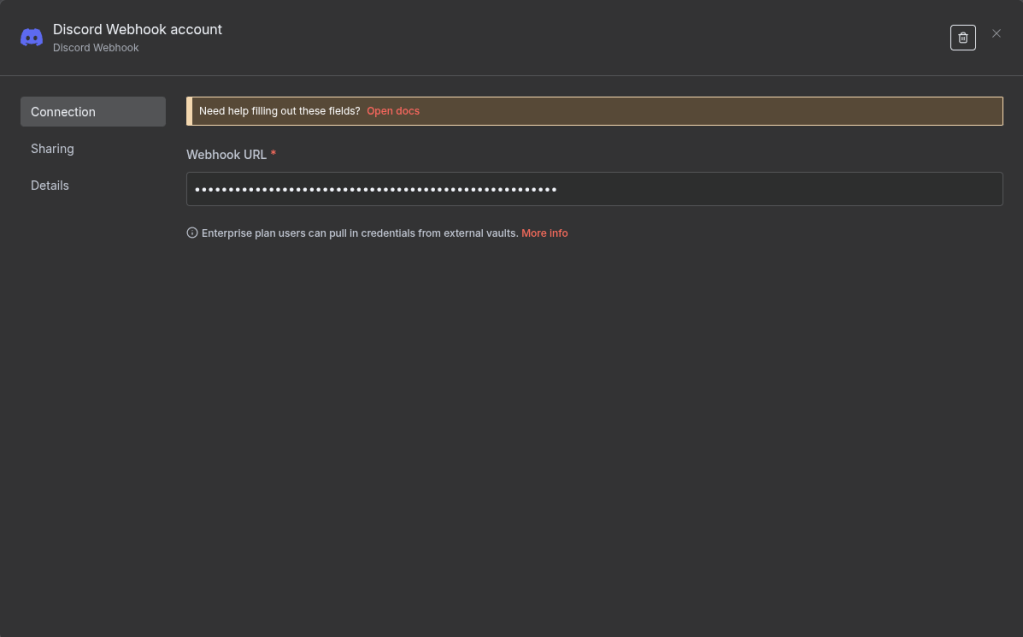
After setting up the credentials, make sure that the “Send Message” option is available and that you are pulling the json.text field into the message. (This is what the LLM is outputting to the Discord node).
Go back and select “Execute Workflow” to test and run. You should see a message come through into discord if there are any alerts in your environment.
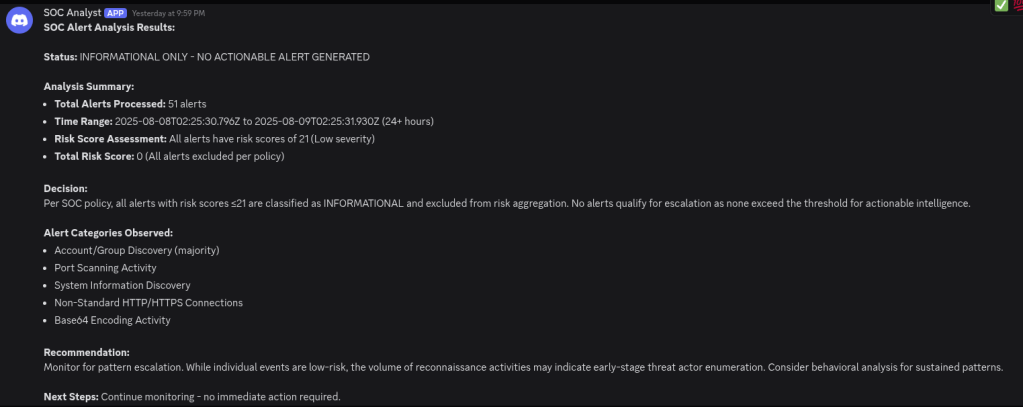
Per my own policy, it looks like there is nothing for me to be concerned about here.
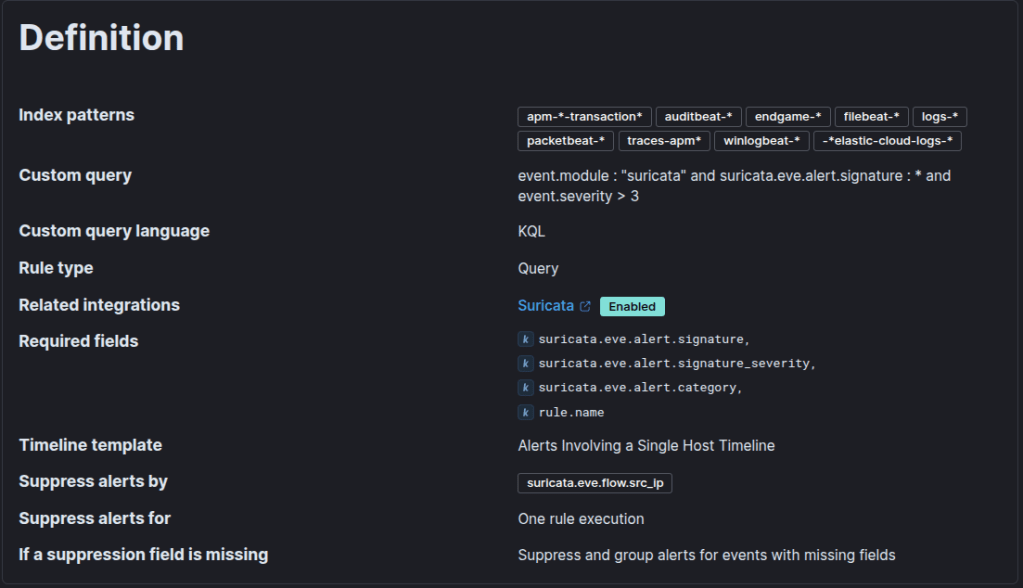
NOTE: Keep in mind that, in order for the alerts API to pull in Zeek and Suricata alerts, you need to configure SIEM rules to pull the data into the alerts index. This will look different for every environment. Elastic Defend, by default, will pull the endpoint alerts into the appropriate index.
Sample Suricata rule:
That is all! Now I can go each day knowing automation is handling my alerts and that alert fatigue is an issue no more!
