Honeypot using IONOS VPS and Cowrie
I want to create a safe honeypot to try to capture malicious IPs and perform research on them. To do so, I am going to run a cheap VPS in the cloud and remotely pull logs from it.
Requirements
- IONOS VPS
- Ubuntu 22
Optional
- ELK stack
Outcomes
- Malicious IP research
- Cowrie configuration
- User based authentication
- Deceptive defender techniques
- Integrate honeypot intel into threat intelligence feeds & detections within Elastic
Step #1: Login to public facing VPS using credentials and change SSH management settings
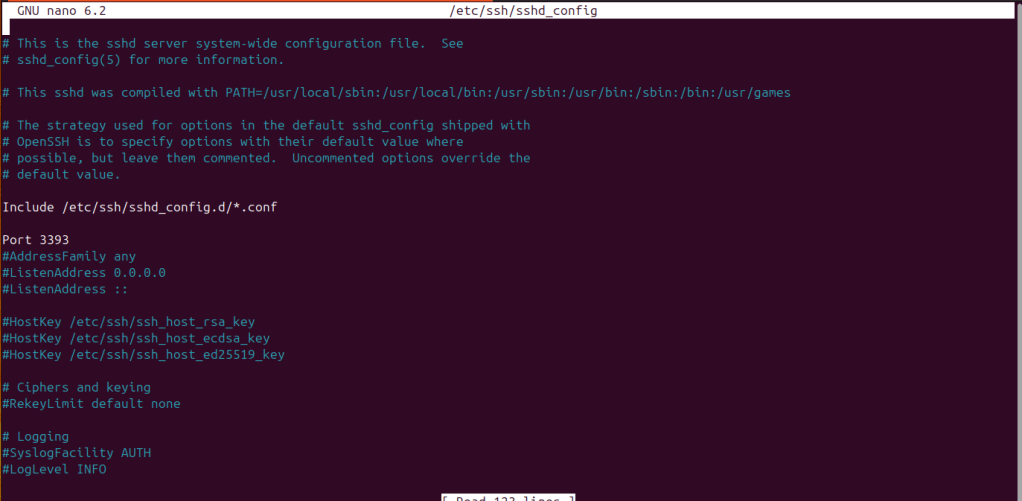
Change the port you use to administer the server
sudo nano /etc/ssh/sshd_config
Find the Port setting and change it to 3393 or another number you prefer
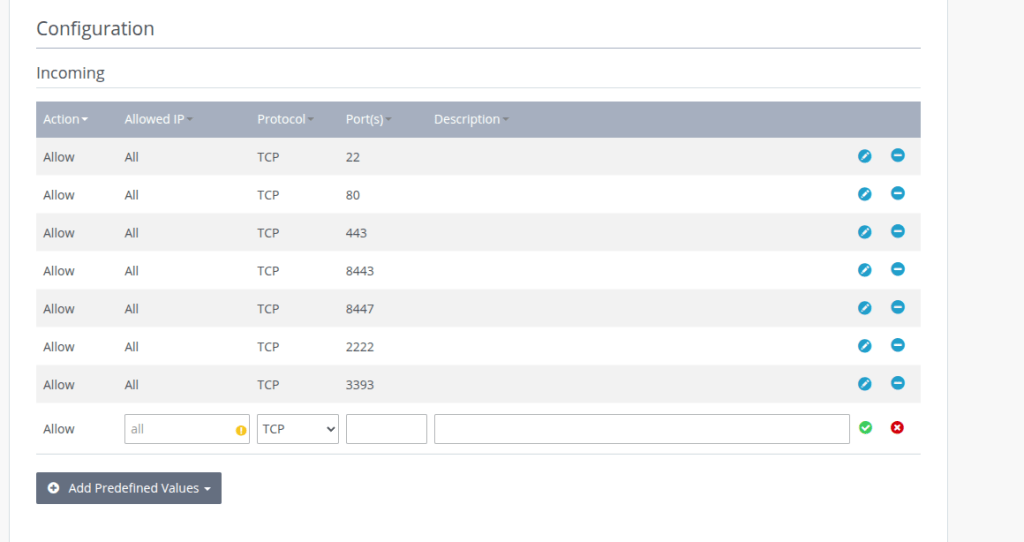
You may also need to adjust your firewall settings if you are using a VPS; add a rule to allow incoming connections on port 3393.
Step #2: Configure cowrie
Create a dedicated user account for security purposes (We do not want an attacker logging in with root permissions to the machine…)
# As root (or use sudo)
adduser --disabled-password --gecos "" cowrie
Download and install system dependencies
apt update
apt install -y git python3 python3-venv python3-dev libssl-dev libffi-dev build-essential authbind
# Allow Cowrie to bind to port 22
touch /etc/authbind/byport/22
chown cowrie:cowrie /etc/authbind/byport/22
chmod 755 /etc/authbind/byport/22
Become the Cowrie user
su - cowrie
Clone the Cowrie github repository, and navigate to the directory
git clone https://github.com/cowrie/cowrie.git
cd cowrie
Create a Python virtual environment in order to keep system dependencies from conflicting with each other and install the requirements from the GitHub repo.
python3 -m venv cowrie-env
source cowrie-env/bin/activate
pip install --upgrade pip
pip install -r requirements.txt
Now we are going to move into configuring the Cowrie honeypot with our own settings. This is done through the cowrie.cfg file. You can add many different settings and customize it how you would like; for this blog, we are going to add a couple of fake usernames and passwords for attackers to log in with.
cp etc/cowrie.cfg.dist etc/cowrie.cfg
nano etc/cowrie.cfg
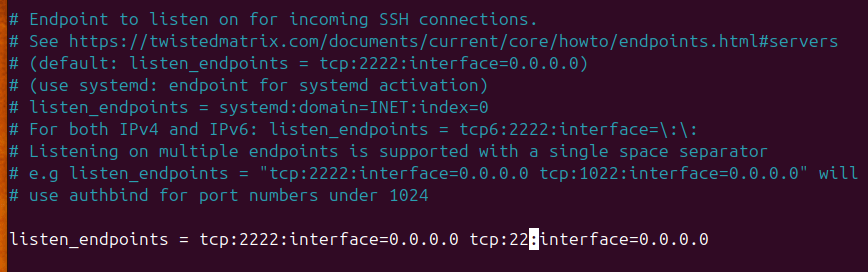
Find the listen_endpoints setting within the config and adjust it to allow cowrie to listen on port 22 (For SSH access)
listen_endpoints = tcp:22:interface=0.0.0.0
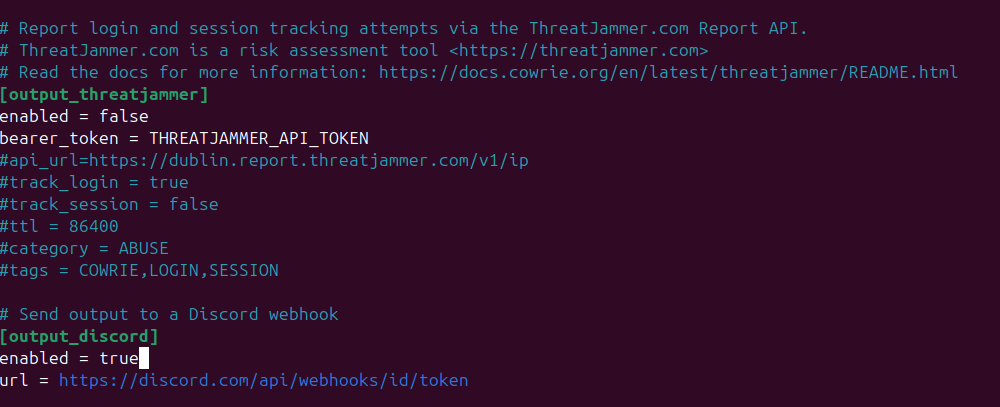
While in the config file, if you would like to be notified when someone accesses your honeypot, we can send the output of the cowrie.log file over to a Discord server of our choice using a webhook.
The last thing we are going to do before starting the honeypot is add a couple of fake users; we can do this by creating a “userdb.txt” file. Within the Cowrie config, there is a setting that points to the userdb.txt to grab fake users for authentication.
echo -e "root:x:rootpass\nadmin:x:admin\nuser:x:123456\nguest:x:guest" >> ~/cowrie/etc/userdb.txt
cd ~/cowrie
Start Cowrie with authbind
authbind --deep bin/cowrie start
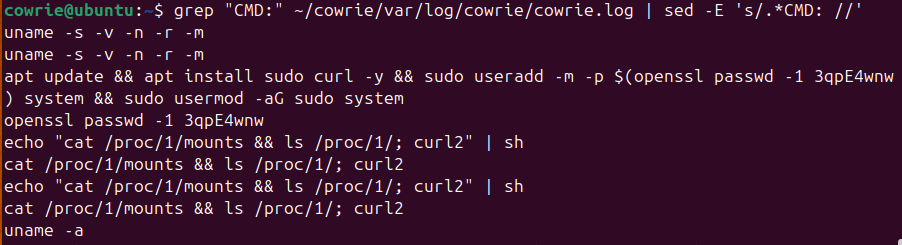
After letting the honeypot run, we can run a couple commands to see what IP’s and commands are being run on the server
grep "CMD:" ~/cowrie/var/log/cowrie/cowrie.log | sed -E 's/.*CMD: //'
grep -oP '\b(?:[0-9]{1,3}\.){3}[0-9]{1,3}\b' ~/cowrie/var/log/cowrie/cowrie.log | sort | uniq
Step #3: Integrate with Alienvault and Elastic stack
Next up, let’s set up a way for Cowrie to automatically send IOCs over to a created AlienVault Pulse. We can build out a Python script and use the OTX Python library tools in order to accomplish this.
import re
from OTXv2 import OTXv2
from datetime import datetime

# Your OTX API key here
OTX_API_KEY = 'f9450bfed2d27c6eb5389dc8000b0942163fdb4825ab6809d89a60094300d145'

# Path to your Cowrie plain text log
LOG_FILE = '/home/cowrie/cowrie/var/log/cowrie/cowrie.log'

PULSE_NAME = "Honeypot IPs " + datetime.now().strftime('%Y-%m-%d')
PULSE_DESCRIPTION = "IPs observed in honeypot log"
EXPIRATION_DATE = "2025-12-31T00:00:00"

# Initialize OTX API client
otx = OTXv2(OTX_API_KEY)

# Read the Cowrie log file content
with open(LOG_FILE, 'r') as f:
    log_data = f.read()

# Regular expression to match IPv4 addresses
ip_pattern = r'\b(?:[0-9]{1,3}\.){3}[0-9]{1,3}\b'

# Find all unique IP addresses in the log
found_ips = sorted(set(re.findall(ip_pattern, log_data)))

# Prepare indicators for the pulse
indicators = []
for ip in found_ips:
    indicators.append({
        "indicator": ip,
        "type": "IPv4",  # Pass string, not enum
        "title": f"Honeypot connection from {ip}",
        "description": f"Observed in Cowrie log on {datetime.now().strftime('%Y-%m-%d')}",
        "expiration": EXPIRATION_DATE,
    })

# Create the pulse if we have indicators
if indicators:
    otx.create_pulse(
        name=PULSE_NAME,
        public=False,
        indicators=indicators,
        description=PULSE_DESCRIPTION,
        tags=["cowrie", "honeypot", "threatintel"],
        tlp="white"
    )
    print(f"[+] Created pulse with {len(indicators)} indicators.")
else:
    print("[*] No IPs found in the log.")
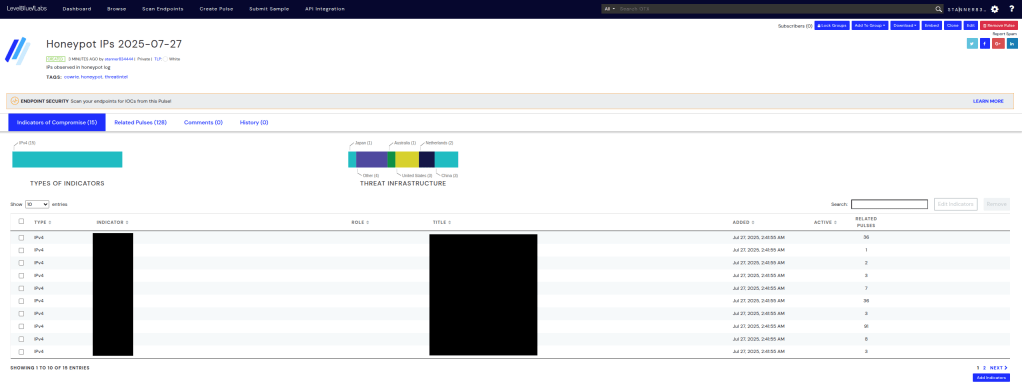
After running the above Python script, we can navigate to our Alienvault account and see the related IPs.
Lastly, rounding out my blog, because we can grab all the IPs using an Elastic integration with AlienVault, we can create a detection rule to identify times where a destination address is associated with one of the IPs listed in our threat intelligence. Creating a rule is pretty simple using KQL, as listed below.
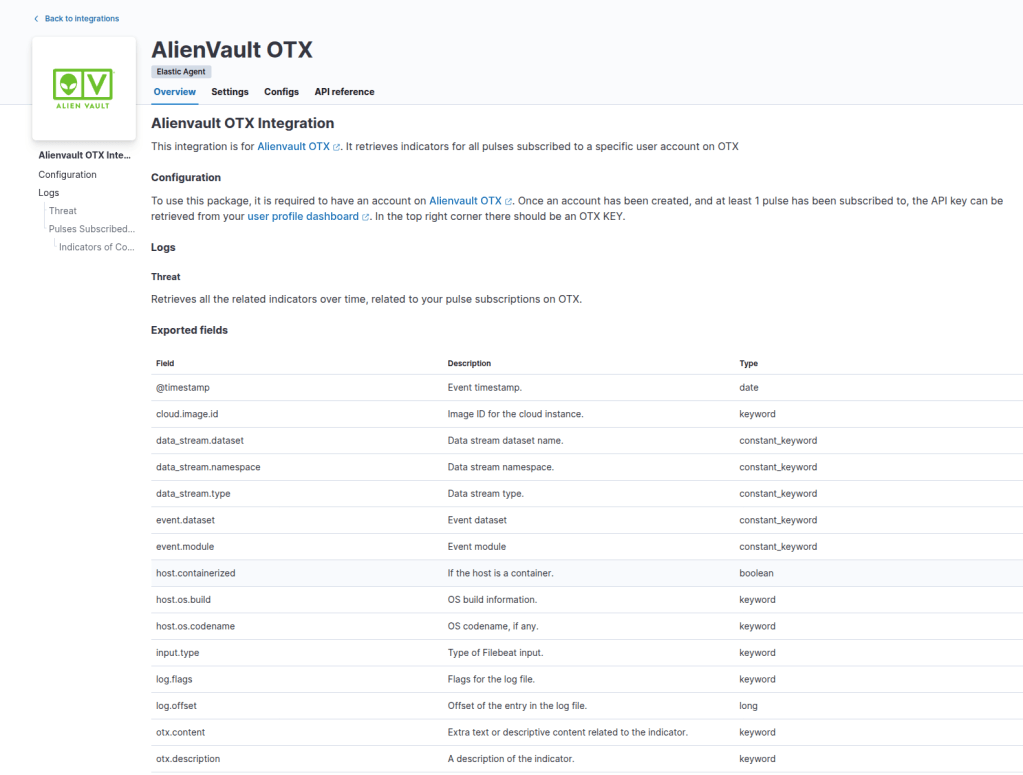
First, search for the integration within Elastic
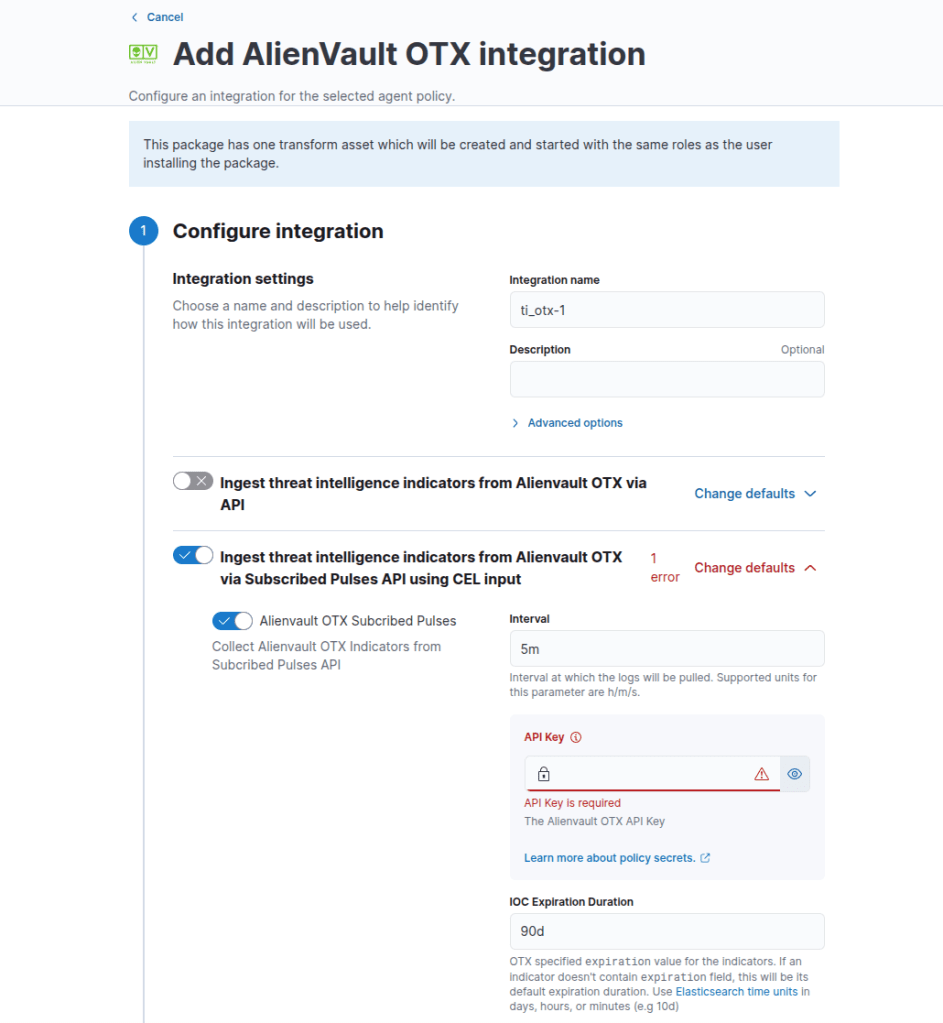
Add the integration with your own name; I am configuring this within the existing Fleet server I am running.
After waiting a couple of minutes, we can navigate over to observability > logs to see if any new telemetry is visible.
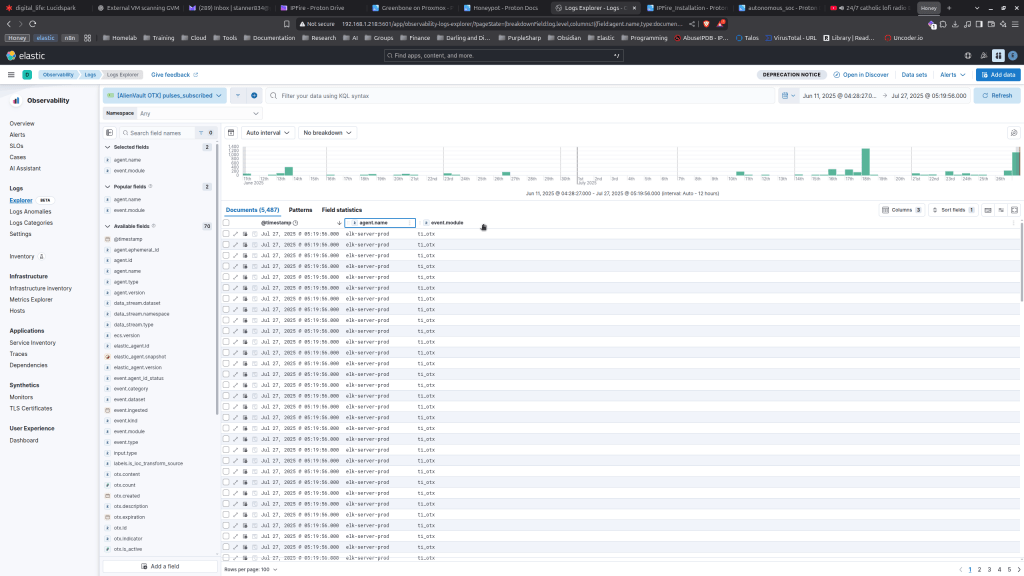
Great, now we can see we are ingesting logs from our OTX integration. Now let’s create a detection to capture events where we have a Zeek network connection event to an IP within the honeypot and other AlienVault Pulse feeds we subscribe to.
You can create the new rule by going into the Rules > Detection Rules > Create rule
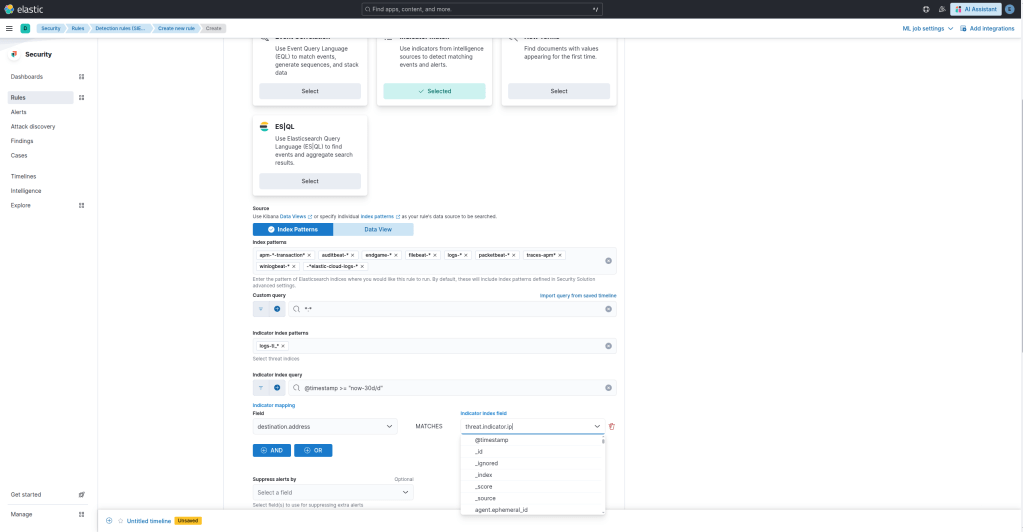
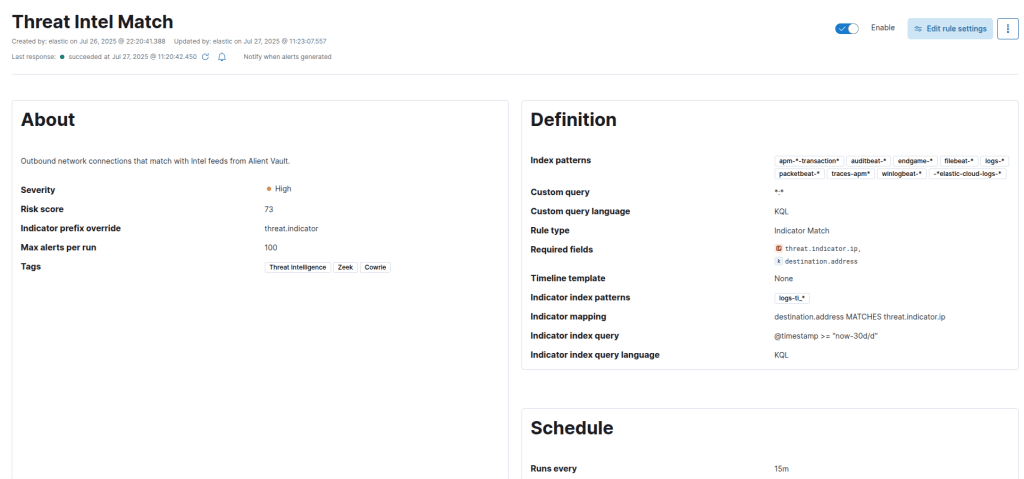
Select a KQL query, and within the indicator mapping section, all we are going to do is set the following logic:
destination.address MATCHES threat.indicator.ip
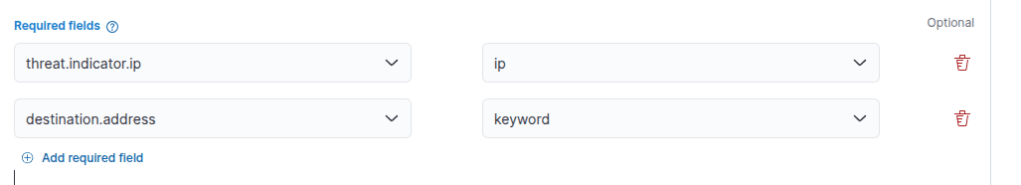
Below that, you are going to want to add some required fields to ensure when alerts come through you have the context you need. I found that the threat.indicator.ip and destination.address were the only two I needed.
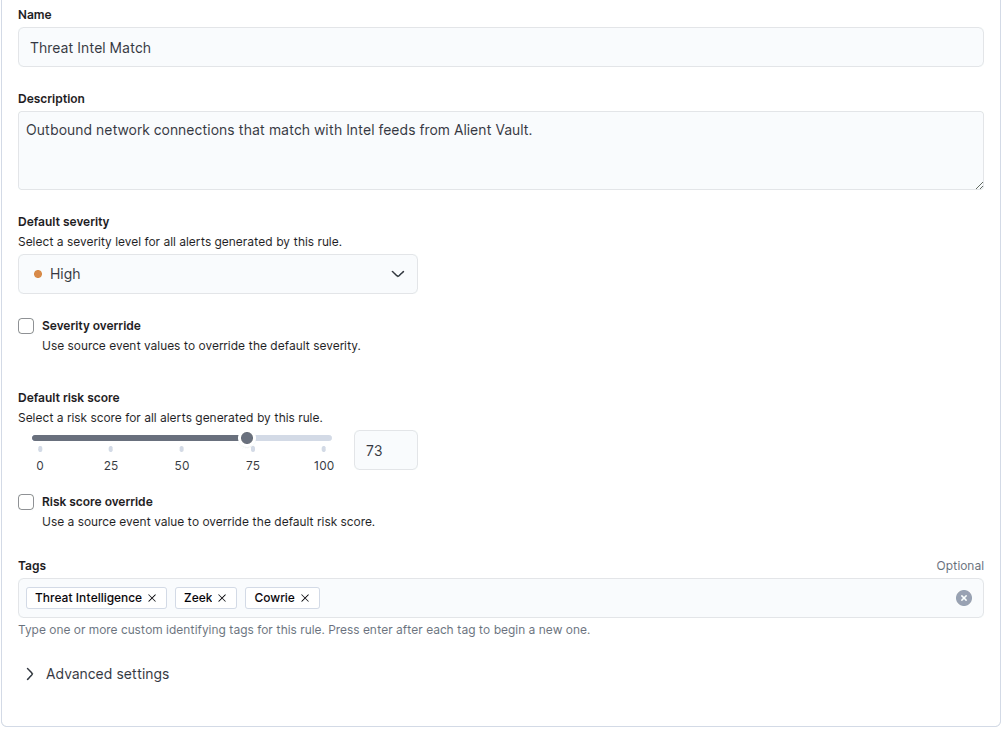
Adjust the rule description, severity, and tags to the settings you prefer. I am going to set the criticality to high and add a couple of tags for cowrie, threat intelligence, and zeek for context.
Set the schedule to run every 15 minutes and look back every 24 hours to ensure nothing is missed.
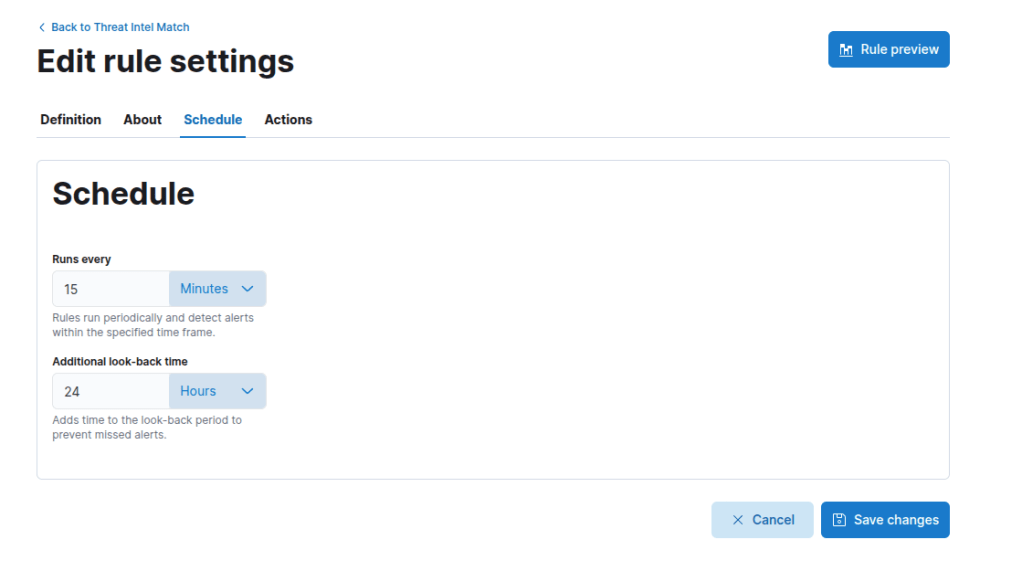
Select “Save Changes” and you are all good to go!
Congratulations, you have now configured your own honeypot, threat intel feed, and detection logic feedback loop.
